Stock Trading and Graphs

On May 6, 2010, a computer glitch caused the Dow Jones stock market value to drop by and then regain over 400 points all in a span of a few minutes. The stock market is increasingly run by computers, and it is important that programs which interact with the stock market do not have mistakes in them.
In this lab you will be using stock market data, manipulating
tuples, and visualizing data. This lab also reinforces the ideas of
modules, you will get a module for accessing stock data: StockData.py
and you will write functions in a module for simulated trading of stocks,
in the module StockTrader.py.
Start by snarfing the code from the class website. Alternatively, you can browse code here.
The StockData module gives you a way of getting information about various
stocks. The functions getWebData and getFileData take a stock
abbreviation as well as a start/end date as parameters and return a list
of stock information acquired from the internet and from local files, respectively.
You will start by working with the local data to test your code. Once you have confidence
in your solution, you can access the web to get more current and varied data.
Each function returns a list of tuples, each tuple has the form (date, price, volume) denoting the date of the data, the closing price of the stock that day, and the number of shares of the stock that were traded that day. These tuples will be sorted in the list from the earliest to most recent date. The stock symbol/name is not part of this tuple. For example, the call belows gets data on Google's stock (abbreviation GOOG) from January 1, 2013 to January 1, 2014
data = StockData.getWebData("GOOG", "20130101", "20140101")
print(data)
and prints a list, part of which is shown below. Note the list contains elements each of which is one of the described three-tuples.
[('2013-01-02', 723.25, 2541300), ('2013-01-03', 723.67, 2318200), ('2013-01-04', 737.97, 2763500), ...
Note, you can access individual elements of each tuple in the list by "double" indexing, i.e., indexing the resulting tuple from indexing the list, like so:
To find the maximum price in a list of these tuples the functiondata[0][0] == '2013-01-02'
getMaxPrice below is given as an example:
def getMaxPrice (data):
    return max([ s[PRICE] for s in data ])
Working with the Code
In this part, write code to ensure you understand the form the data is in and how to use tuples.
-
Complete the function
getMaxPriceDatewhich takes as a parameter a list of tuples as described above and returns the date on which the stock was at its highest price. - Complete the function
getAveragePricewhich takes as a parameter a list of tuples as described above (in practice this might be a slice of all the data) and returns the average price of the stock in the list. As a reminder, the average price is the total of all the prices divided by the number of prices/days. You can assume the list of tuples given is not empty.
Graphing and Visualizing Data
We will use another module, matplotlib.pyplot, which is used for plotting graphs. This module is already imported in StockTrader.py
and it is useful for creating a variety of simple graphs. For the sake of convenience, we have used the
as keyword when importing the module so that we can call it
plt instead of its full name. The simplest form of graph is to call
the plot function with a list of data that you want to plot, and
then call the show function. There are several ways to use the
plot function, but the one we will focus on is passing two same-length lists as
arguments
to it,
one of x-values and one of y-values.
As an example, the following code will plot a line segment from the point (0,2) to (1,3) and another line segment from (1,3) to (2,5).
plt.plot([0,1,2], [2,3,5])
plt.show()
-
Complete the function
plotPriceswhich takes in a list of tuples of stock data and plots all the prices of this data. This is to say, the x-values will be the indices in the list, and the y-values will be the prices at those indices.You should create a list of x-values (0 to number of elements in the list), a list of y-values (stock prices for each element in the list) and then call
plt.plot(days,
	      prices)
, for example. Your plot should be similar to the one below for Google.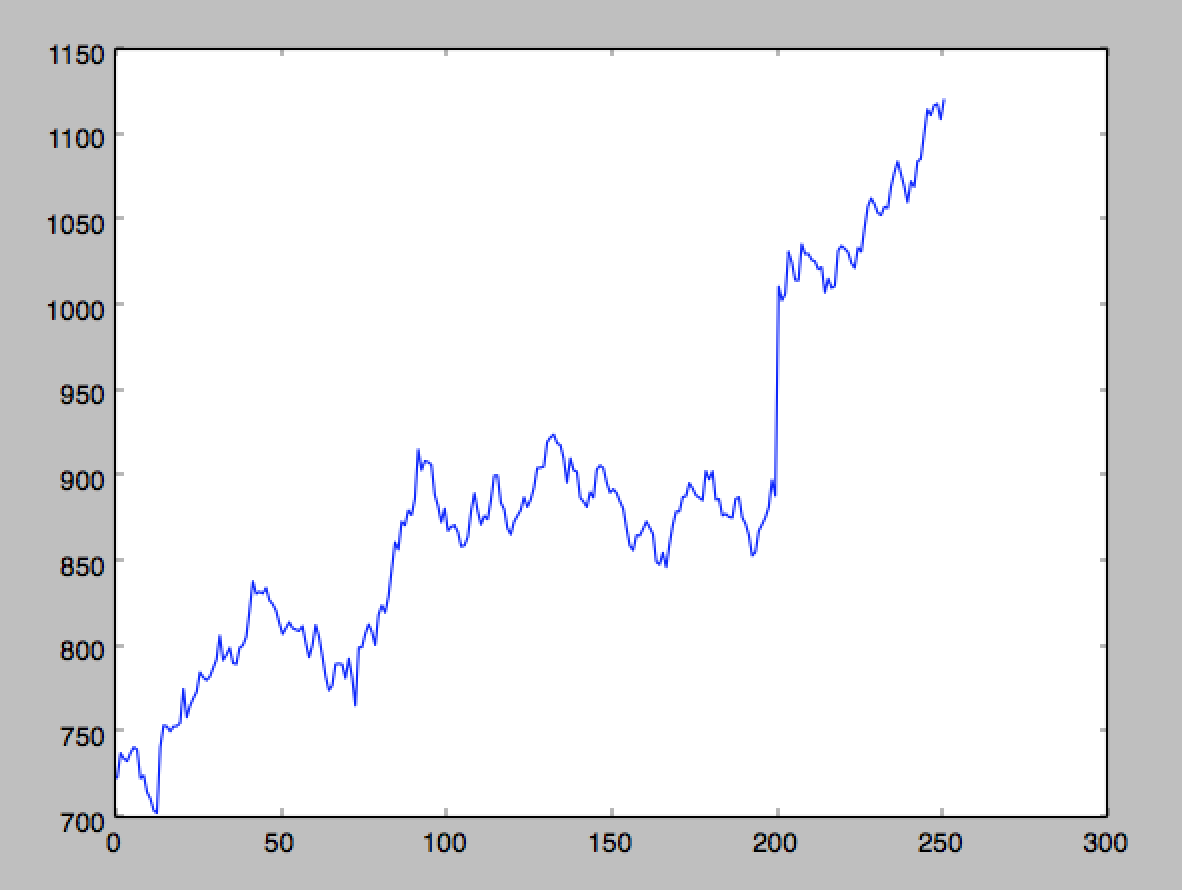
-
Now, let's tie all of this together. We want to know whether it is a good time to buy or sell a stock, and one way to do that is to compare the current price to the stock's average price over the past few days — if it is way above the average, it is time to sell, and if it is way below the average price, it could be time to buy.
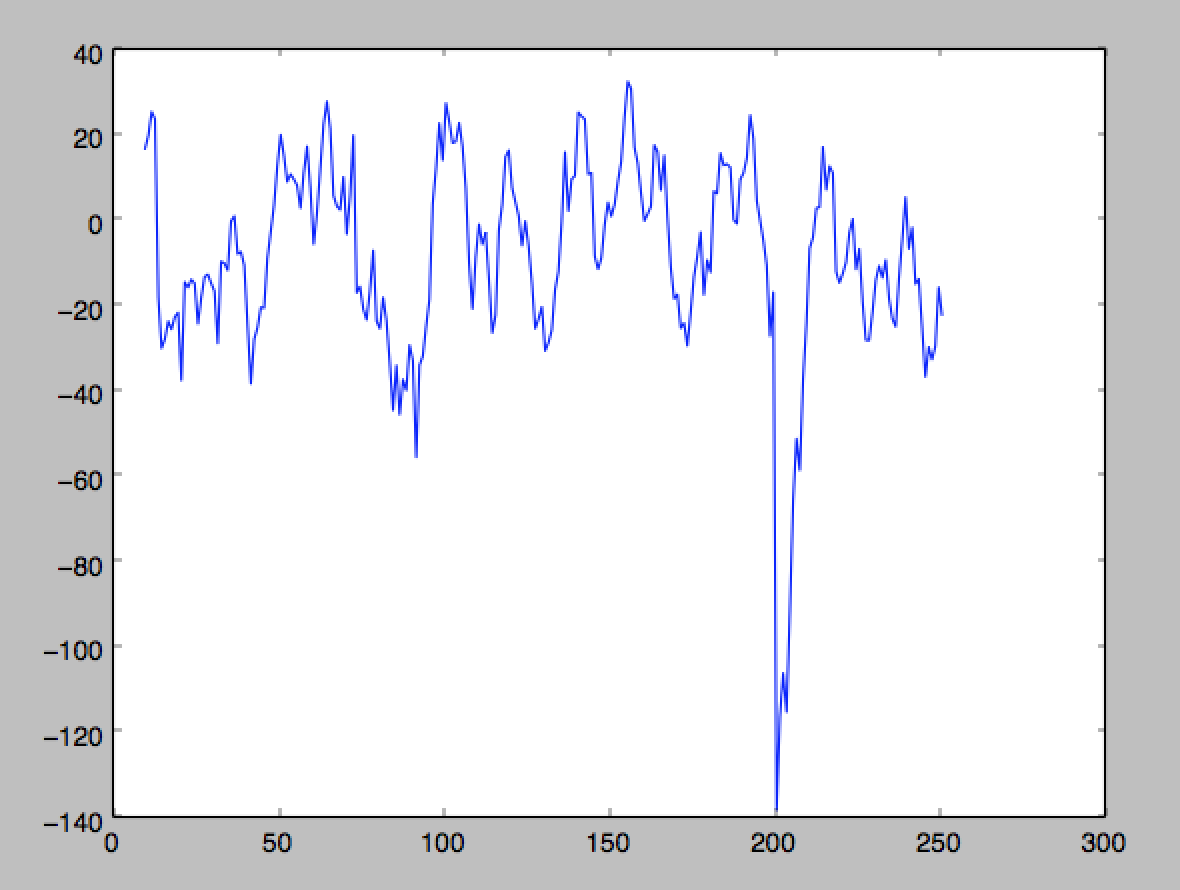
Complete the function
plotPriceVsAveragewhich makes a graph of this information. For each tuple in the parameterdata, calculate a number for each day (after and including the 10th day) that results from subtracting the current stock price from the average price of the previous 10 days. To calculate the values, call thegetAveragePricefunction you wrote with a slice likedata[i-10:i]to get the average of 10-days worth of data. Plot these values, starting with day 10. Your plot should be similar to the one below for Google.